|
iQue Forecyt® Reference Guide (Version 9.0)
|
Summary of Analysis Right-Click Functions
Many of the analysis capabilities of iQue Forecyt® are unlocked with right-click functions that open sub-menus. There are right-click menus specific to plots and histograms, heatmaps, dose response curves, and profile maps.
Plots and Histogram Right-Click
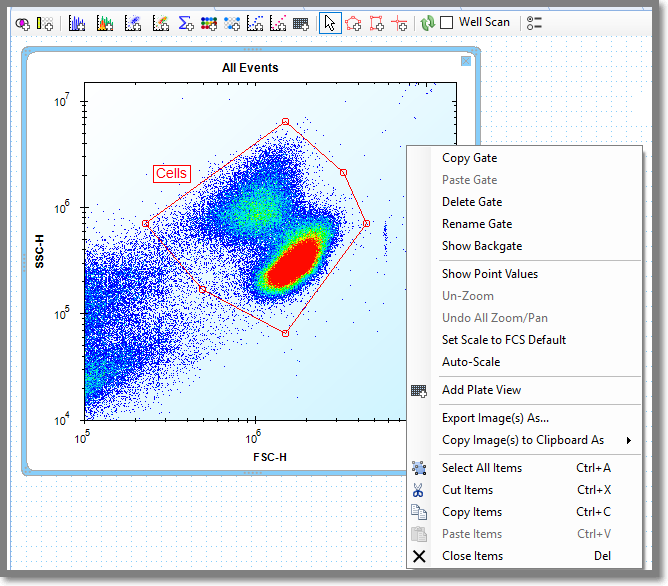
The following screenshot displays the right-click on a plot. The menu includes copy and paste functions for gates. Un-zoom is dimmed if zoom was not performed. You can zoom with either the tool, or the scroll wheel on your mouse.
Copy/Paste Gate
To Copy, left click on a gate boundary to select it. The gate turns from black to red. Move your mouse to the location where you want to Copy the gate. Right-click to enable Paste. You can only Paste a gate if it was copied from another plot with the exact same axis and the exact same parameter.
Delete Gate
Right-click on a gate and select Delete. Because there is no un-do for this operation, iQue Forecyt® gives you the chance to change your mind with a Confirm message that includes the gate label name.

Rename Gate
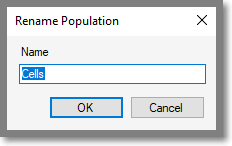
Choosing Rename opens a box that allows you to type in a new name for the gate label. The box shows the original gate label which you must first delete. Click OK to apply change.
Show Point Values
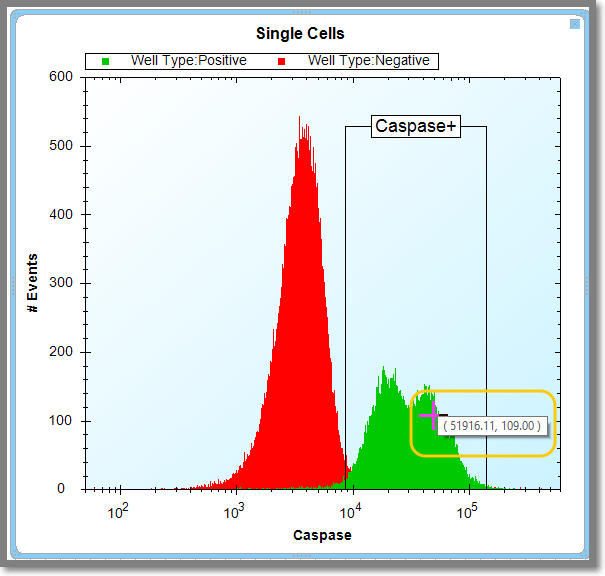
Clicking Show Point Values allows you to skim your mouse over a plot or histogram and see the point values. The tooltip turns into a cross-hairs as shown in the following screenshot of a histogram.
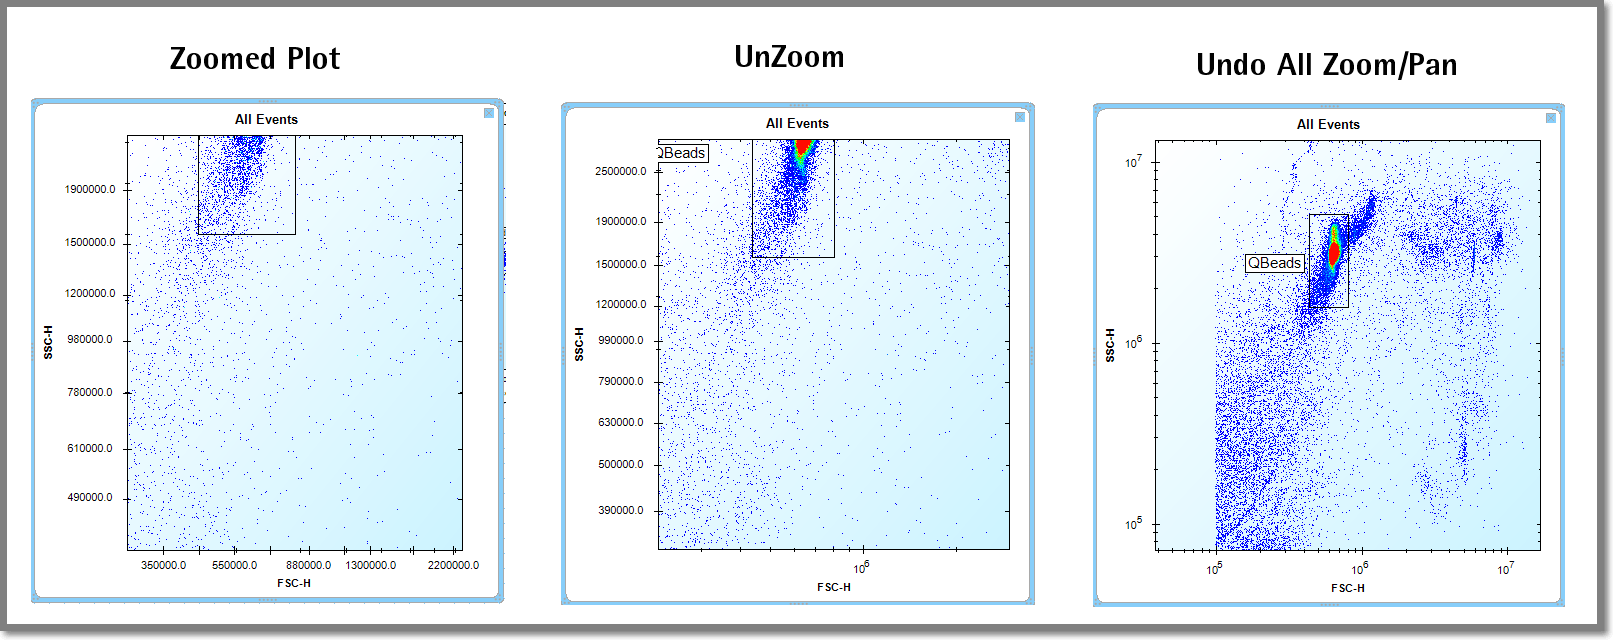
Unzoom/Undo All Zoom/Pan
UnZoom, backs out of a zoomed in plot, one mouse click at a time. If you're really zoomed in on a plot or histogram, Undo All Zoom/ Pan is a quick way to restore the plot or histogram to it's original state.
Set Scale to FCS Default
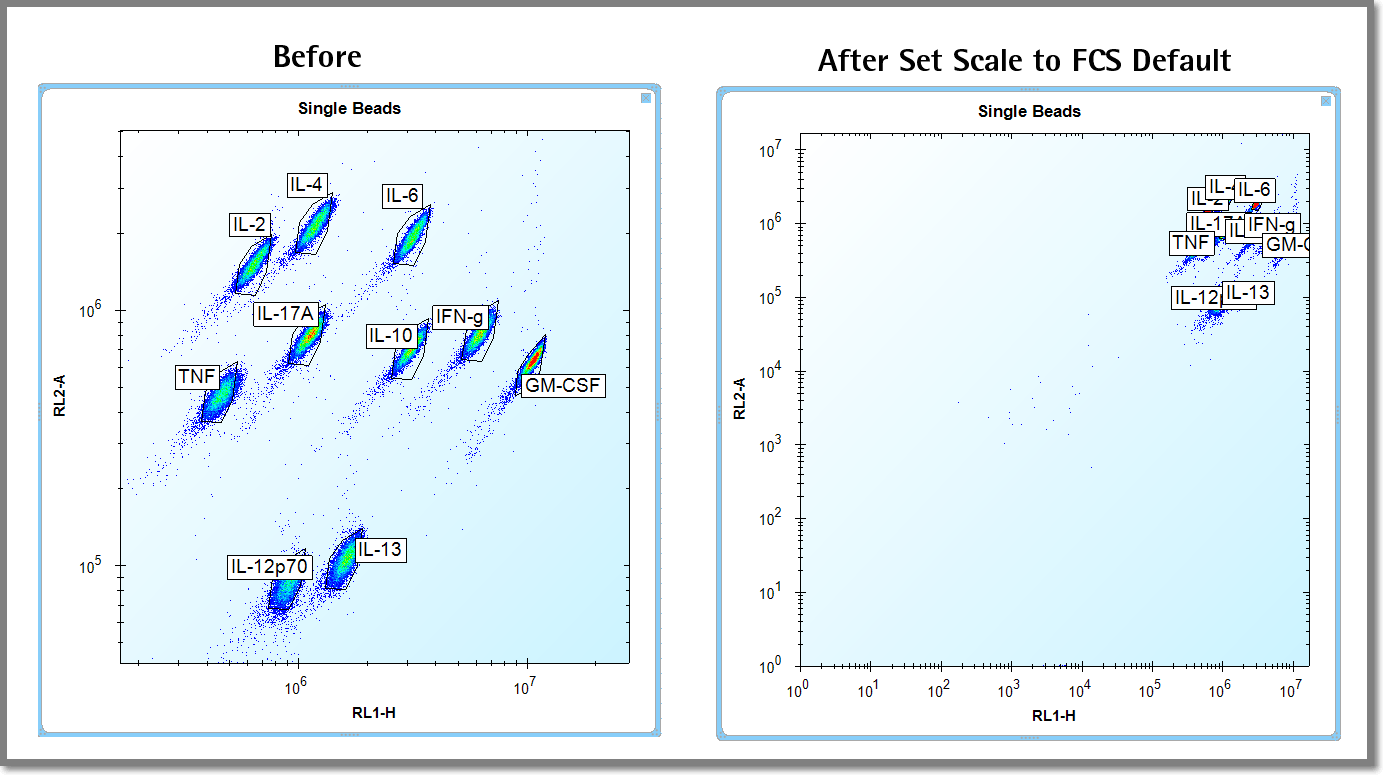
Set Scale to FCS Default shows the scaling of the full range of events the instrument can detect. (Sometimes this looks like a lot of empty space.) The following screenshot shows a plot without and with FCS Default
AutoScale
Autoscale shows the lowest to the highest number of events.
Add Plate View
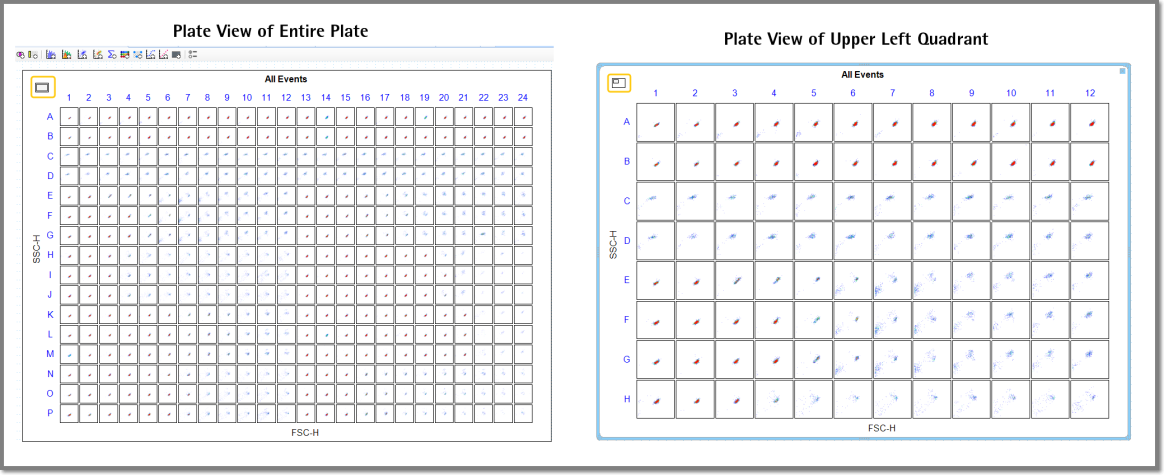
Add Plate View generates a thumbnail plot or histogram of every well on the plate. Because the plots or histograms are really tiny, you can view one quadrant at a time by clicking on the the small rectangle in the upper-left corner. Each click on this box rotates through another quadrant from top left to bottom right. The following screenshot illustrates a full plate and the upper left corner.
Export Image(s) As. . .
When you click on Export Images(s) As. . . a Windows file saving dialog opens that allows you to save and image or images in a location on your computer. The following screenshot shows this export dialog.

• File Name: By default this will be a descriptive name based on the particular analysis object being exported. You can change it to whatever you want.
• Save as type: the export format for the image can be BMP, JPG, PNG, TIF, or EMF (Enhanced Windows MetaFile).
• Export Option DPI: the dots per inch (DPI) that the image will be rendered at for export. The DPI is always 96 for BMP and is not applicable to Vector (EMF) images.
The default format for image export is initially 300 DPI JPEG for all users. This can be changed by exporting or copying images to clipboard in a different format. The most recent format will then be used as the initial values during export and copy to clipboard operations.
Copy Image(s) to Clipboard As
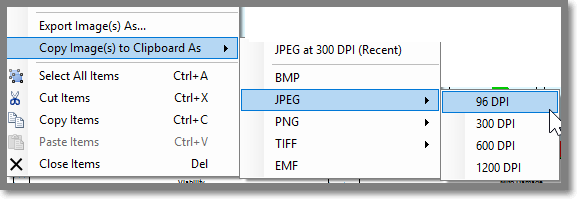
You can copy images to the clipboard in a variety of file formats and image resolutions, as shown in the following screenshot.
Select All Items
Select All Items selects all the plots and/or histograms in the workspace.
Cut/Copy Items
Cut and Copy moves a plot or histogram to the clipboard so that it can be pasted into another Analysis tab. Copy will also do a Copy Image to Clipboard as the most recently selected format.
Paste Items
Paste puts an item Cut or Copied to the clipboard on the workspace, either on the tab from which it was Cut/Copied or another tab.
Close
Close removes an item from the workspace.